

Friday 5 Marketing Observations – Delivering Meaningful Moments

Photo by Mesut Kaya on Unsplash
Can you believe we just hit May. Wow the years flying by.
I had my head down playing & designing AI Artificial Intelligence Tools for a client. So I had to brush up on my Python skills… Once dive into Ai it’s going to create to big advantages for those who get their head around the marketing implications… I’m looking at far you can push this technology still add value to your marketing…
I was so immersed in this project I nearly forgot to write Friday 5 Marketing Observations, By I got it done, a bit late, but done anyway.
Delivering Meaningful Moments
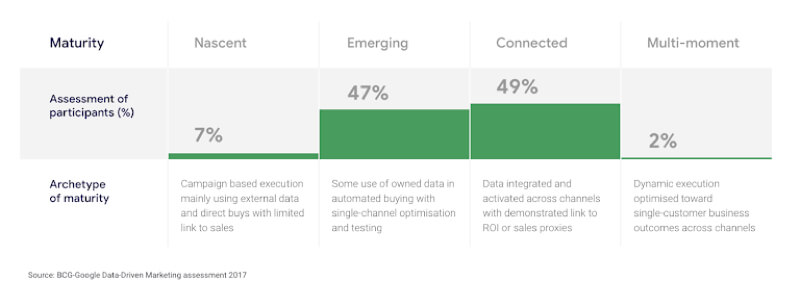
New research from Boston Consulting Group (BCG) commissioned by Google found that leading businesses who are growing their customer base, ROI and competitive advantage focus on adopting a path to full data-driven marketing and attribution. Those that succeed are seeing significant benefits – up to 30% in cost efficiency savings and 20% increase in revenue.
According to the Boston Consulting Group (BCG), the path to data-driven marketing maturity is made up of four stages: nascent, emerging, connected and multi-moment.
- I remember reading Google’s ZMOT Report on the Zero Moment of Truth about 7 years ago… The ZMOT refers to the moment in the buying process when the consumer researches a product prior to purchase…
- just 2% – who are seeing efficiency and ROI benefits by successfully connecting with consumers at multiple moments across the purchase journey through personalized content… The analysis shows that 7% of companies surveyed are still in the earliest stage of the shift to data-driven marketing… The second category – emerging – is represented by 41% of companies in the study. These are making some use of their own data in automated buying, but are optimising and testing on a channel-by-channel basis…
- The final step revolves around making every moment matter… According to BCG, companies who take this journey will see incremental gains along the way and could see up to a 30% cost efficiency savings and 20% increase in revenues by moving from the early stages of data-driven marketing to a full multi-moment focus…
Go Read –Delivering Meaningful Moments
Facebook Ad I learned That Will Help You Run Better Ad Campaigns in 2019

For the past several years, I’ve taken a moment every December to reflect on what I’d learned about Facebook ads that year. I’ve turned those thoughts into blog posts, in hopes that these lessons help guide YOU in the New Year.
This is the FIFTH edition of this post (scroll below to see my thoughts from previous years), and it’s so interesting to scroll through and see how quickly things change over such a short period of time…
- Molly Pittman has put a comprehensive Facebook Advertising Guide… What makes this even cleverer is this is the 5th year they have done this article, so they keep adding each new years content to the article… Google love anchor content gets updated to each time the republish they get readers coming back & more new visitors…
- Understand That Scaling Paid Traffic Campaigns Involves More Than Just Increasing Your Budget… This valuable lesson, for example, imagine you were spending $100 a day on a campaign and generating 50 leads for $2 a lead. Most people would expect to increase the budget to $200 a day and in return receive 100 leads for $2 a lead. agencies trying to win the business… The lesson just because you’re bored with the copy doesn’t mean its still not working… This usually not the case with Facebook…
- Put More Thought into Your Creatives… Your ad creative should act in 2 ways.. 1 – As a visual representation of your hook, whatever message you’re wanting to portray to the end user… 2 – A trust-building mechanism with your brand…
Go Read –Facebook Ad I learned That Will Help You Run Better Ad Campaigns in 2019
Global Wealth Report: 2018: US and China In The Lead
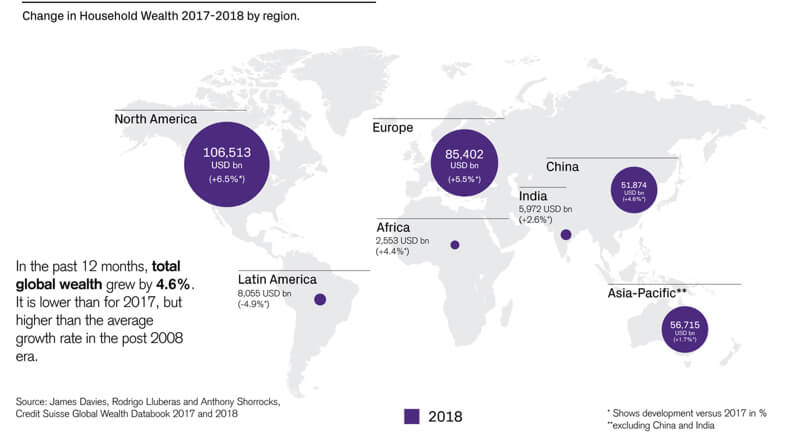
Global wealth increased by 14 trillion USD last year – with China ranking second after the USA. Credit Suisse’s Global Wealth Report breaks down the world’s wealth and analyses the global outlook.
Our latest findings show that the world was wealthier in the past than our previous analysis indicated. New official statistical data and other reliable sources have led us to revise our estimate. The revision mostly relates to non-financial assets owned by the middle class.
During the twelve months to mid-2018, aggregate global wealth rose by USD 14.0 trillion to USD 317 trillion, representing a growth rate of 4.6%. This was also sufficient to outpace population growth, so that wealth per adult grew by 3.2%, raising global mean wealth to USD 63,100 per adult, a record high…
- Yeaha, Switzerland and Australia lead the pack… Switzerland (USD 530,240), Australia (USD 411,060) and the United States (USD 403,970) again head the league table according to wealth per adult. The ranking by median wealth per adult favours countries with lower levels of wealth inequality and produces a slightly different table. This year, Australia (USD 191,450) edged ahead of Switzerland (USD 183,340) into first place…
- This golden age came to a halt with the global financial crisis. The pattern of wealth creation also changed significantly. Top wealth holders benefited most from the rise in financial wealth, leading to rising wealth inequality in all parts of the world. In every region bar China, median wealth stopped rising, and in many places declined…
- Global wealth is projected to rise by nearly 26% over the next five years, reaching USD 399 trillion by 2023. Emerging markets are responsible for a third of the growth, although they account for just 21% of current wealth…
Go Read –Global Wealth Report: 2018: US and China In The Lead
Optimize Your CTA: Better Alternatives To ‘Click Here’

Effective calls to action on webpages motivate visitors by providing descriptive labels, incentives to “click here”, and understandable directions.
How do you optimize links for search engines and people?
It Begins by = Understanding user goals and user behavior… Establishing trust…Creating accessible, clearly labeled directions that inspire interest.
- Tim Berners-Lee wrote a style guide for link construction in 1992. Here are some bits of wisdom on why we do not click here:…
- The trick to optimizing calls to action is to present the action at the precise moment when your website visitor is most interested in taking the next step…. There has to be compelling content preceding the link, as well as an accurate description of the landing page…
- I spent half a day working with a client’s graphic designer, he got so stuck trying to make the buttons look pretty, he missed the function of what the buttons meant to do… This next example is a mixture of a button, text sentence, and text sentence with a clickable icon overlaying a large header image…
Go Read –Optimize Your CTA: Better Alternatives To ‘Click Here’
10 Tools That Optimize Your WordPress Images For A better UX

Photo by Johannes Plenio on Unsplash
No one likes a slow-loading website. Long load times aren’t just horrible for the user experience; they can also negatively impact a website’s SEO. For many WordPress sites, long load times are due to unoptimized images. This content, literally, bogs down traffic and potential profits. However, large files aren’t the only reason your UX could tank. You also need to choose the right images for conveying your message.
This guide will explain how to use image optimization tools to modify images for faster load times. Meanwhile, use our Slickplan Content Planning tool to ensure your images stay synced to the rest of your content!
- Why you should be Optimising, your images They Ensure your images load faster, adjusting images for screen size and platforms
Adjusting images for screen size and platforms… When you take the time to focus on these things, your WordPress site will not only delivers a better user experience, but it could also significantly improve search results and lower website costs… - Try a smaller file type. Online images are typically in one of two formats: PNG (.png) or JPEG (.jpg). JPEGs, generally, are photos; whereas PNGs are usually used for web elements, logos, or anything with transparency… One of the easiest ways to speed things along is to merely make images smaller, via compression, before uploading them to your WordPress site…
- Many tools offer a choice between lossy or lossless compression. The difference basically comes down to quality. Lossless compression is ideal for preserving the quality of a photo, whereas lossy compression removes some data to make a file smaller, ultimately impacting the final result…
Go Read –10 Tools That Optimize Your WordPress Images For A better UX